FEBRUARY 2026 MARKET STATISTICSCentral Texas housing market gains momentum as spring selling-season approachesAUSTIN, Texas — According to the February 2026 Central Texas Housing Report

Dated: March 11 2026
Views: 681
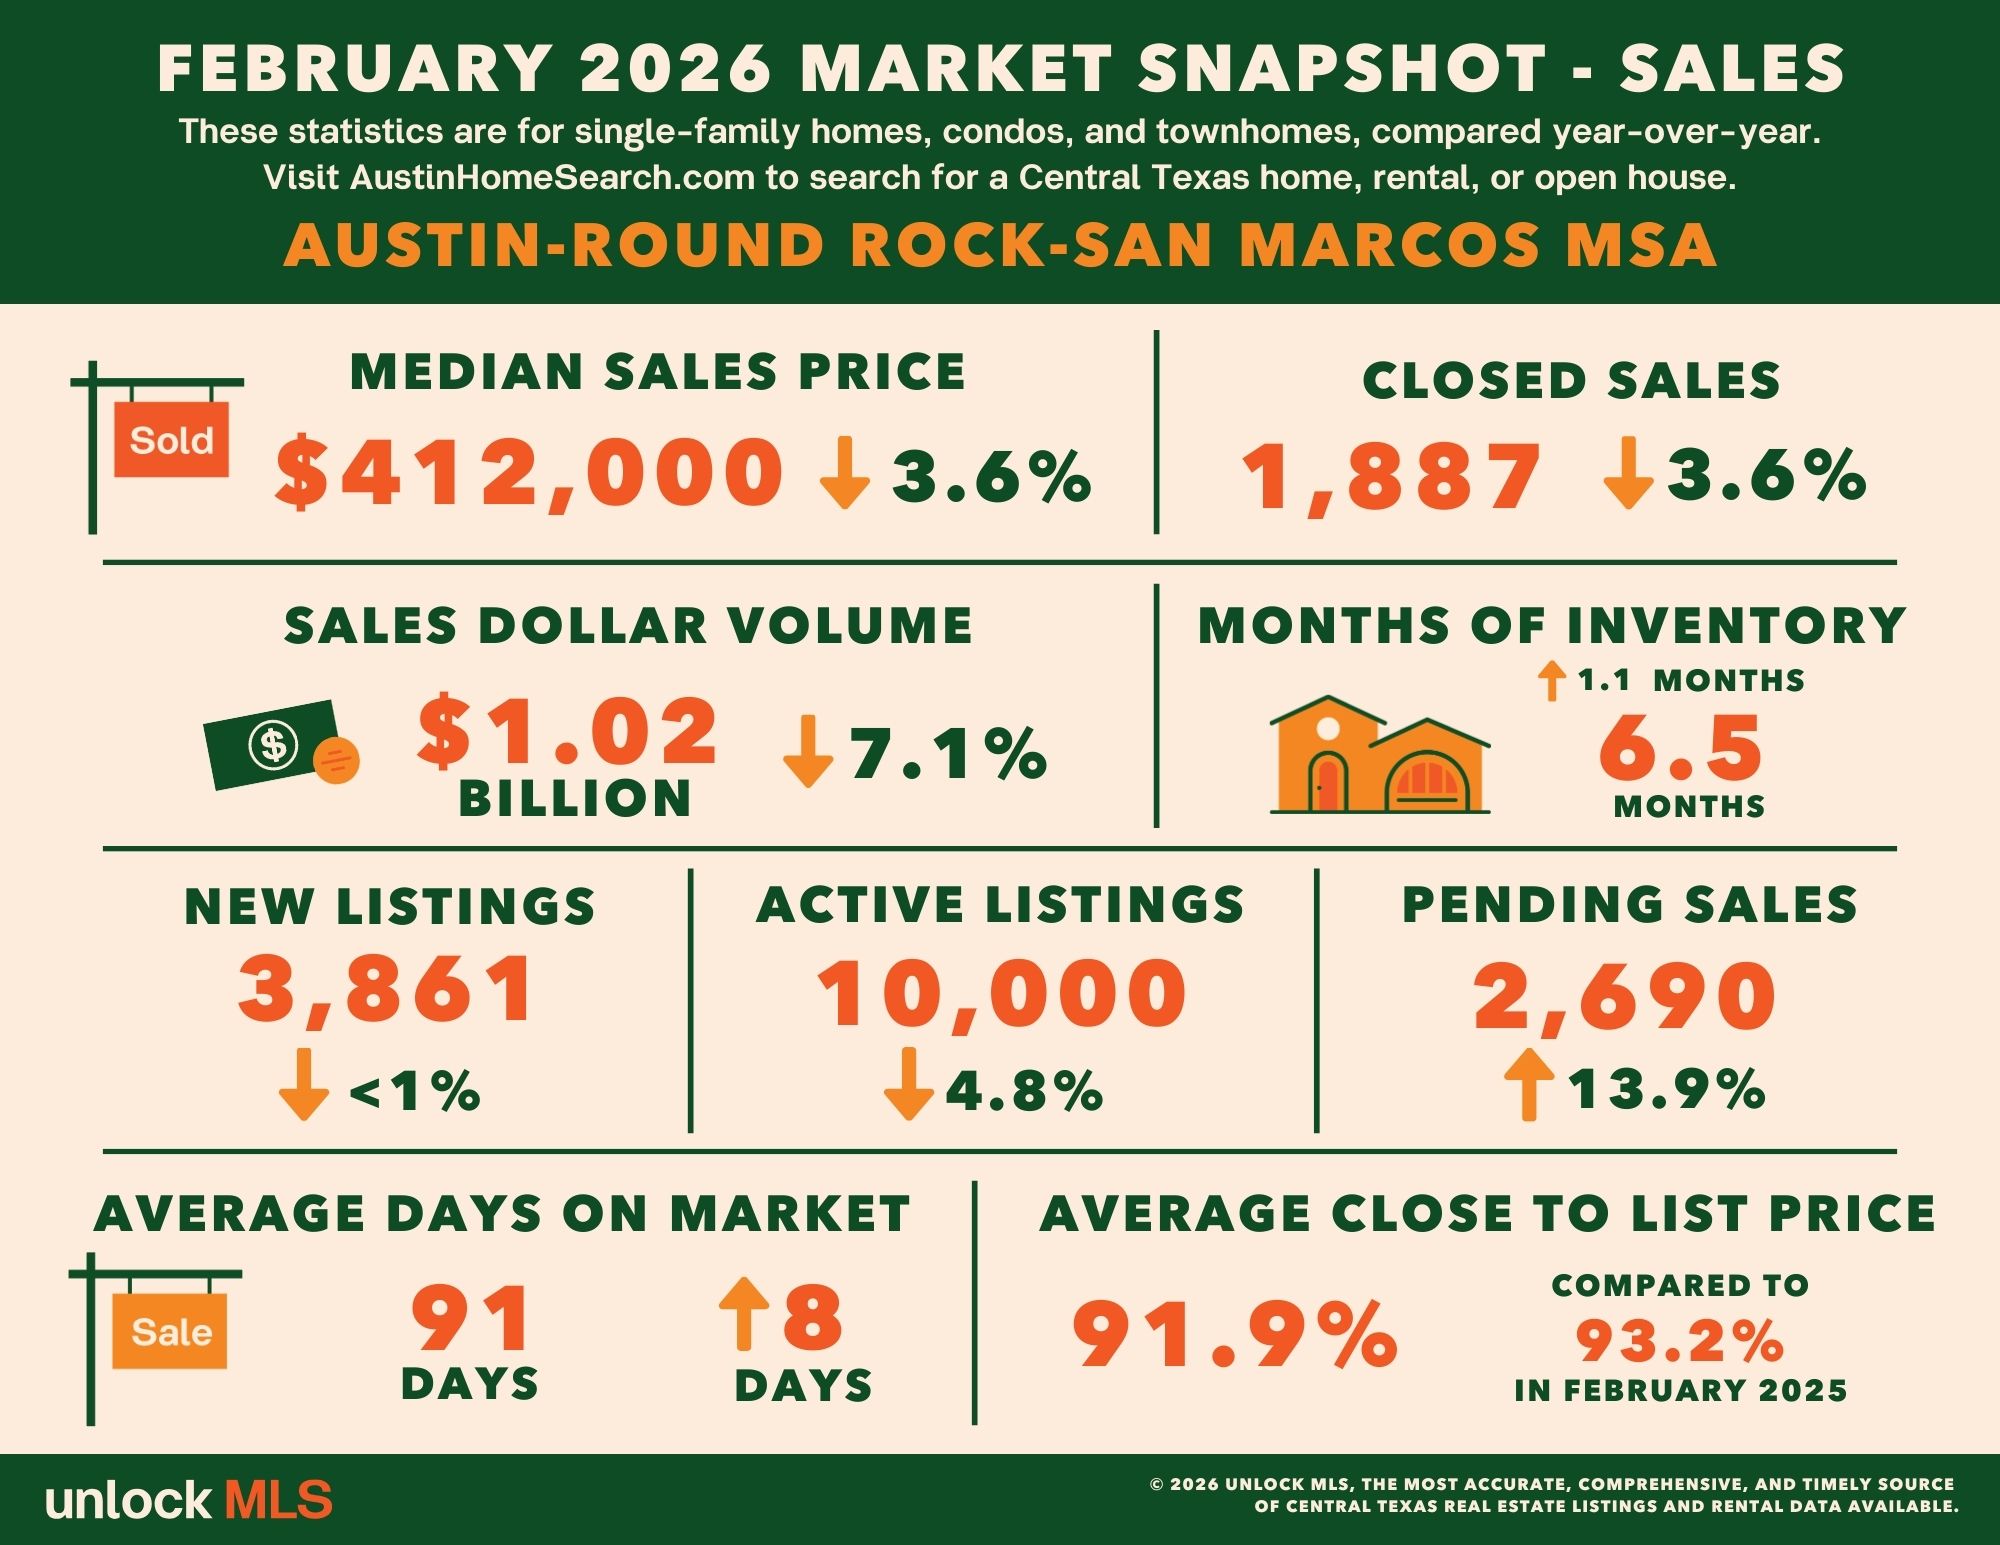
AUSTIN, Texas — According to the February 2026 Central Texas Housing Report released by Unlock MLS, the Austin-Round Rock-San Marcos MSA is showing renewed momentum heading into the spring homebuying season. Pending sales reached 2,690 transactions in February, up 13.9% year over year. At the same time, the close-to-list price ratio improved from 90.6% in December to 92.0% in February, signaling that buyers and sellers are more aligned.
Vaike O’Grady, market research advisor at Unlock MLS, noted that the recent data shows a clear shift in market activity from recent trends.
“The inventory count average was around 12,076 for the past two years, but in February, we saw active listings fall to 10,000 across the MSA, down 4.8% from a year ago. This tells us that sellers are returning to the market at roughly the same pace as last year, but buyers are coming back faster. These balanced market conditions have given buyers a chance to catch up. It’s a good sign that healthy momentum is fueling the market.”
John Crowe, 2026 Unlock MLS and ABoR president, said the latest market data is giving buyers and sellers a clearer picture of where conditions are heading.
“A lot of buyers have spent the past year watching and waiting, wondering if prices would keep falling or if they should hold out longer. What we’re seeing now is that market conditions are increasingly favorable for more buyers to act. That’s where the Multiple Listing Service and working with a professional agent need to go hand in hand. Unlock MLS gives agents the most current and comprehensive view of the market, so clients aren’t making decisions based on headlines but on real data and professional market expertise.”
Austin-Round Rock-San Marcos MSA
February 2026 - For Sale
1,887 – Residential homes sold, 3.6% less than February 2025.
$412,000 – Median price for residential homes, 3.6% less than February 2025.
3,861 – New home listings on the market, 0.8% less than February 2025.
10,000 – Active home listings on the market, 4.8% less than February 2025.
2,690 – Pending sales, 13.9% more than February 2025.
6.5 – Months of inventory, 1.1 more than February 2025.
$1,022,593,378 – Total dollar volume of homes sold, 7.1% less than February 2025.
91.9% – Average close to list price, compared to 93.2% in February 2025.
February 2026 - For Lease
2,304 – Closed leases, 4.2% more than February 2025.
$2,000 – Median price for rent, 4.8% less than February 2025.
2,913 – New lease listings on the market, 18.1% more than February 2025.
6,447 – Active lease listings on the market, 59.6% more than February 2025.
2,639 – Pending sales, 16.9% more than February 2025.
2.8 – Months of inventory, 0.7 months more than February 2025.
$5,224,059 – Total dollar volume of leases, 0.4% less than February 2025.
96.2% – Average close to list price, flat compared to February 2025.
City of Austin
February 2026 - For Sale
664 – Residential homes sold, 4.7% less than February 2025.
$540,000 – Median price for residential homes, 2.7% less than February 2025.
1,399 – New home listings on the market, 3.8% less than February 2025.
3,148 – Active home listings on the market, 13.0% less than February 2025.
923 – Pending sales, 15.1% more than February 2025.
6.2 – Months of inventory, 1.0 more than February 2025.
$476,868,162 – Total dollar volume of homes sold, 7.8% less than February 2025.
92.1% – Average close to list price, compared to 92.9% in February 2025.
February 2026 - For Lease
1,184 – Closed leases, 11.2% more than February 2025.
$2,100 – Median price for rent, 5.6% less than February 2025.
1,556 – New lease listings on the market, 25.7% more than February 2025.
4,163 – Active lease listings on the market, 105.4% more than February 2025.
1,343 – Pending sales, 26.3% more than February 2025.
3.0 – Months of inventory, 0.6 months more than February 2025.
$2,878,921 – Total dollar volume of leases, 3.5% more than February 2025.
96.1% – Average close to list price, compared to 95.8% in February 2025.
Travis County
February 2026 - For Sale
843 – Residential homes sold, 4.5% less than February 2025.
$489,900 – Median price for residential homes, 2.0% less than February 2025.
1,930 – New home listings on the market, 2.4% more than February 2025.
4,513 – Active home listings on the market, 8.6% less than February 2025.
1,234 – Pending sales, 14.4% more than February 2025.
6.6 – Months of inventory, 1.0 months more than February 2025.
$564,564,716 – Total dollar volume of homes sold, 8.3% less than February 2025.
91.9% – Average close to list price, compared to 93.1% in February 2025.
February 2026 - For Lease
1,336 – Closed leases, 11.0% more than February 2025.
$2,096 – Median price for rent, 4.7% less than February 2025.
1,780 – New lease listings on the market, 26.6% more than February 2025.
4,163 – Active lease listings on the market, 74.0% more than February 2025.
1,505 – Pending sales, 23.7% more than February 2025.
3.0 – Months of inventory, 0.6 months more than February 2025.
$3,232,081 – Total dollar volume of leases, 4.5% more than February 2025.
96.1% – Average close to list price, compared to 96.0% in February 2025.
Williamson County
February 2026 - For Sale
663 – Residential homes sold, 1.8% less than February 2025.
$395,850 – Median price for residential homes, 5.4% less than February 2025.
1,141 – New home listings on the market, 5.5% less than February 2025.
3,109 – Active home listings on the market, 1.6% less than February 2025.
903 – Pending sales, 17.1% more than February 2025.
5.8 – Months of inventory, 1.1 months more than February 2025.
$300,184,245 – Total dollar volume of homes sold, 5.7% less than February 2025.
92.7% – Average close to list price, compared to 93.8% in February 2025.
February 2026 - For Lease
709 – Closed leases, 3.4% less than February 2025.
$2,000 – Median price for rent, 4.8% less than February 2025.
780 – New lease listings on the market, 2.1% more than February 2025.
1,582 – Active lease listings on the market, 37.2% more than February 2025.
853 – Pending sales, 13,0% more than February 2025.
2.3 – Months of inventory, 0.6 months more than February 2025.
$1,464,845 – Total dollar volume of leases, 7.7% less than February 2025.
96.6% – Average close to list price, compared to 96.4% in February 2025.
Hays County
February 2026 - For Sale
267 – Residential homes sold, 3.3% less than February 2025.
$355,000 – Median price for residential homes, 1.4% less than February 2025.
536 – New home listings on the market, 6.3% less than February 2025.
1,502 – Active home listings on the market, 9.2% less than February 2025.
375 – Pending sales, 5.0% more than February 2025.
6.4 – Months of inventory, 0.4 months more than February 2025.
$119,458,023 – Total dollar volume of homes sold, 1.7% less than February 2025.
91.7% – Average close to list price, compared to 92.6% February 2025.
February 2026 - For Lease
197 – Closed leases, 4.4% less than February 2025.
$1,950 – Median price for rent, 2.3% less than February 2025.
252 – New lease listings on the market, 16.1% more than February 2025.
489 – Active lease listings on the market, 23.2% more than February 2025.
221 – Pending sales, 0.9% more than February 2025.
2.8 – Months of inventory, flat compared to February 2025.
$418,906 – Total dollar volume of leases, 5.0% less than February 2025.
96.0% – Average close to list price, compared to 96.6% in February 2025.
Bastrop County
February 2026 - For Sale
83 – Residential homes sold, 11.7% less than February 2025.
$335,000 – Median price for residential homes, 4.9% less than February 2025.
194 – New home listings on the market, 11.5% more than February 2025.
688 – Active home listings on the market, 15.2% more than February 2025.
128 – Pending sales, 4.9% more than February 2025.
10.1 – Months of inventory, 3.2 months more than February 2025.
$30,794,664 – Total dollar volume of homes sold, 13.3% less than February 2025.
89.7% – Average close to list price, compared to 93.0% in February 2025.
February 2026 - For Lease
40 – Closed leases, 4.8% less than February 2025.
$1,850 – Median price for rent, 2.4% less than February 2025.
67 – New lease listings on the market, 34.0% more than February 2025.
133 – Active lease listings on the market, 98.5% more than February 2025.
40 – Pending sales, flat compared to February 2025.
2.6 – Months of inventory, 0.6 months more than February 2025.
$70,969– Total dollar volume of leases, 10.5% less than February 2025.
95.9% – Average close to list price, compared to 95.3% in February 2025.
Caldwell County
February 2026 - For Sale
31 – Residential homes sold, 6.9% more than February 2025.
$221,990 – Median price for residential homes, 23.5% less than February 2025.
60 – New home listings on the market, 9.1% more than February 2025.
188 – Active home listings on the market, 19.7% more than February 2025.
50 – Pending sales, 51.5% more than February 2025.
5.9 – Months of inventory, 3.5 months more than February 2025.
$7,591,730– Total dollar volume of homes sold, 16.2% less than February 2025.
82.9% – Average close to list price, compared to 91.8% in February 2025.
February 2026 - For Lease
22 – Closed leases, 15.4% less than February 2025.
$1,725 – Median price for rent, 4.2% less than February 2025.
34 – New lease listings on the market, 17.2% more than February 2025.
80 – Active lease listings on the market, 166.7% more than February 2025.
20 – Pending sales, 23.1% less than February 2025.
4.7 – Months of inventory, flat compared to February 2025.
$37,258– Total dollar volume of leases, 18.8% less than February 2025.
96.8% – Average close to list price, compared to 95.4% in February 2025.
For more information or to download the February 2026 Central Texas Housing Market Report, visit UnlockMLS.com/Stats.
Unlock MLS marks the intersection of knowledge, humanity, and home. For nearly 60 years, we’ve fostered the most complete, accurate, timely, and reliable real estate marketplace for the 18-county Central Texas region. In partnership with the 18,000 real estate professionals who power our MLS, we lead the industry in transparency, data integrity, and a people-first focus to make home buying, selling, and renting accessible and attainable for all. For more information, visit UnlockMLS.com.

With nearly 15 years of experience guiding Greater Austin home buyers and sellers, Scott Hamilton has earned consistent praise for his responsiveness, expertise, and genuine client care. His clients d....
FEBRUARY 2026 MARKET STATISTICSCentral Texas housing market gains momentum as spring selling-season approachesAUSTIN, Texas — According to the February 2026 Central Texas Housing Report
Central Texas housing market opens 2026 with ample listings, stable prices and renewed buyer momentumAUSTIN, Texas — According to the January Central Texas Housing Report released by
 Austin Board of REALTORS® Copyright ©2026 All rights reserved.
33. Required DMCA Notice
The Digital Millennium Copyright Act of 1998, 17 U.S.C. §512, the DMCA, provides recourse for copyright owners who believe that material appearing on the Internet infringes their rights under U.S. copyright law. If you believe in good faith that any content or material made available in connection with our website or services infringes your copyright, you (or your agent) may send us a notice requesting that the content or material be removed, or access to it blocked. Notices must be sent in writing by email to DMCAnotice@MLSGrid.com. The DMCA requires that your notice of alleged copyright infringement include the following information: (1) description of the copyrighted work that is the subject of claimed infringement; (2) description of the alleged infringing content and information sufficient to permit us to locate the content; (3) contact information for you, including your address, telephone number and email address; (4) a statement by you that you have a good faith belief that the content in the manner complained of is not authorized by the copyright owner, or its agent, or by the operation of any law; (5) a statement by you, signed under penalty of perjury, that the information in the notification is accurate and that you have the authority to enforce the copyrights that are claimed to be infringed; and (6) a physical or electronic signature of the copyright owner or a person authorized to act on the copyright owners behalf. Failure to include all of the above information may result in the delay of the processing of your complaint.
